Search Console Performance Report: An Ecommerce Guide
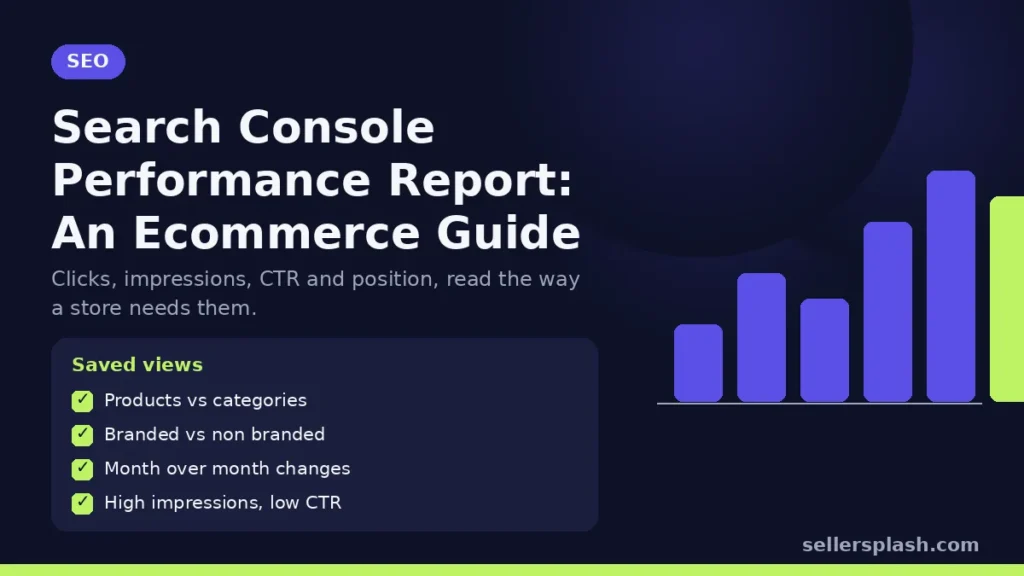
The Search Console Performance report shows how your store performs in Google Search: clicks, impressions, click through rate and average position, broken down by query, page, country, device, search appearance and date. Google's help page for the report explains each metric and dimension. For an online store, the most useful views are product pages versus category pages, branded versus non branded queries, and the pages that gain or lose clicks month over month. The report also includes traffic from Google's AI features, which most analytics tools cannot separate. This guide shows how to set up those views.
The Four Metrics
| Metric | Google's definition | How a store should read it |
|---|---|---|
| Clicks | Times a user clicked your site from Google Search results | Your organic traffic from Google, before analytics filtering |
| Impressions | Times your site appeared in Search results | Visibility, including queries where nobody clicked |
| CTR | Clicks divided by impressions | How well titles, prices and rich results attract the click |
| Average position | Average position of your topmost result | A trend indicator, not a fixed rank |
Definitions from Google's Performance report help. Google also notes that even when a query appears in your list, you might not see your site when you search it yourself, because results depend on time, place, device and recent history.
Pick the Right Search Type
The report defaults to web search. Google lets you switch the search type to web (text based or multimodal), image, video or news. Multimodal covers searches made with images, including Google Lens, Circle to Search on Android, uploaded images and Chrome image search. For product brands, the image and multimodal views are worth checking, because shoppers increasingly search by photo.
5 Views Every Store Should Save
1. Product pages versus category pages
Filter by page with a regex that matches your URL patterns, for example /products/ for product pages and /collections/ for category pages on Shopify. Google's advanced filtering guide explains that the report uses RE2 syntax, that matching is partial unless you use ^ or $, and that you can choose "Doesn't match regex" to exclude values.
2. Branded versus non branded queries
Filter queries with a regex containing your brand name and its common misspellings, then switch to "Doesn't match regex" for non branded demand. Non branded clicks are the growth number, because branded searchers would usually find you anyway.
3. Month over month page changes
Use the date filter to compare the last 28 days with the previous period, then sort pages by click difference. This is the fastest way to spot a product page that dropped after a theme change or a lost rich result.
4. Device comparison
Google's filtering guide lets you compare two devices, countries, search types or search appearances side by side. Compare mobile and desktop CTR for your top product pages, since mobile layouts often push organic results lower.
5. High impression, low CTR queries
Sort queries by impressions and look for low CTR. These are queries where you already rank but do not win the click, often fixable with a better title tag, a clearer price or review markup.
Where AI Overviews and AI Mode Traffic Appears
Google says sites appearing in AI features such as AI Overviews and AI Mode are included in the overall search traffic in Search Console's Performance report, under the web search type. There is no separate AI Overviews filter, so watch the queries and pages where impressions rise while clicks fall, which can be a sign that answers are being given on the results page.
Common Reading Mistakes
- Chart and table totals differ. Google explains the chart aggregates by property, while the table aggregates by page when grouped by page or search appearance, so totals can differ.
- Filters change totals. Google notes that filtering by query or URL can affect totals because of data truncation and the omission of anonymized queries.
- Recent data moves. The newest data can be preliminary and change over the next few hours. Google marks it with a dotted line.
- Position is an average. A page ranking first for a few queries and fortieth for many can show an average in the twenties.
Quick Checklist
- Product and category page regex filters saved
- Branded and non branded query views
- Monthly comparison sorted by click change
- Mobile versus desktop CTR checked for top pages
- High impression, low CTR queries listed for title updates
- Image and multimodal search types reviewed
Where an Agency Fits
The report tells you where to look; the fixes are content, technical and feed work. Our product page SEO guide covers what to change on the pages you find, and our Core Web Vitals guide covers speed. For AI search, see our AI search optimization service.
Want an outside review of your search performance? The Full AI Visibility Audit ($99) reviews how search and AI assistants see your brand, and the Deep Growth Audit ($249) adds search, traffic and product feed checks with a 90 day plan.
Frequently Asked Questions
What does average position mean in Search Console?
Google defines it as the average position of the topmost result from your site. In the table, it is the average position for the URL or grouping shown in that row.
Does Search Console show AI Overviews traffic?
Yes, but not separately. Google says traffic from AI features such as AI Overviews and AI Mode is included in the overall web search traffic in the Performance report.
How do I separate product pages from category pages?
Add a page filter with Custom (regex) that matches your URL pattern, such as /products/ or /collections/. Search Console uses RE2 syntax and partial matching by default.
Why do Search Console chart and table totals differ?
Google explains that the chart aggregates data by property while the table aggregates by page for page and search appearance groupings, so totals can differ.
How do I see non branded traffic in Search Console?
Filter queries with a regex containing your brand name and its variations, and choose Doesn't match regex.
What is multimodal search in Search Console?
Google's multimodal search type covers searches made with images, including Google Lens, Circle to Search, uploaded images and Chrome image search.
AI search and ads readiness checklist
25 checks for Amazon, Walmart and Shopify sellers: tracking, product feeds, Google, Bing and Meta ads, and getting cited by ChatGPT, Perplexity and Google AI Overviews. Two pages, about 20 minutes.
- Break-even ROAS table by margin
- The AI search (AEO) checks most stores miss
- A simple score that tells you what to fix first
No spam. We use your email to send the checklist and follow up about it.
Want to see where your store stands in AI search? Get the Full AI Visibility Audit for $99 or the Deep Growth Audit for $249.
Get your AI visibility audit